The Bitcoin (BTC) market has faced both highs and lows so far this year. After breaching the previous record of $20,000 in December 2020, the top cryptocurrency scaled to heights since a twelve-year journey after hitting $64.8k in mid-April.
Nevertheless, a sharp correction was imminent because it drove Bitcoin’s price to lows of $30k on May 19.
The dropping price on BTC had firstly slumped below the 200-day moving average (MA) since March 2020, due to the coronavirus pandemic caused a state of turmoil globally.
Bitcoin inflows into crypto exchanges have dropped to a 5-month low, as acknowledged by Glassnode. The on-chain metrics provider explained:
“Number of Bitcoin exchange deposits (7d MA) just reached a 5-month low of 2,518.137.”
A low uptick in exchange inflows signifies a holding culture because more users keep their cryptocurrencies in cold storage for speculative or future purposes.
The $30k level has become important for many investors
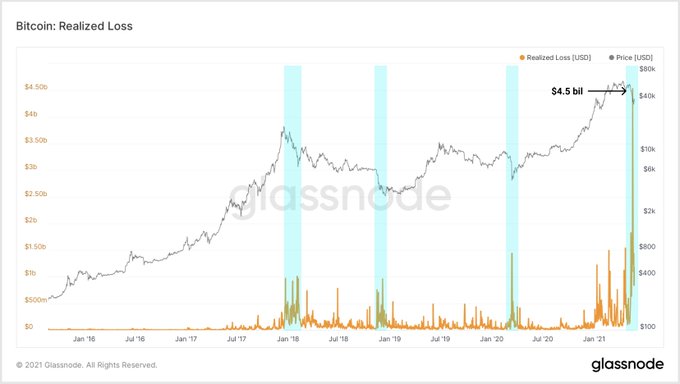
Yann & Jan, Glassnode co-founders, disclosed that the highest realized daily losses in Bitcoin history at $4.5 billion were recorded recently. They stated:
“Highest realized daily losses recorded in history. This shows how many investors support the 30k Bitcoin level. A coin realizes a loss if the price at its last movement was higher than the price of its current movement.”
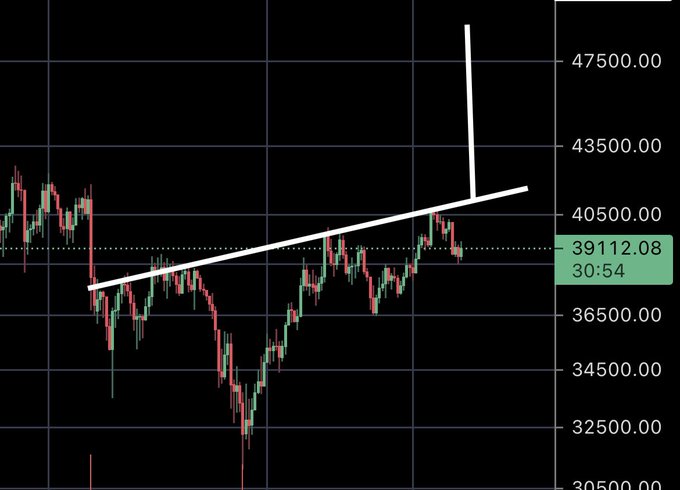
Bitcoin was trading at $39k during the time of writing, according to CoinMarketCap. An analysis by CryptoHamster recently revealed that BTC ought to trade above the $34,000 level for a bullish divergence, creating a signal of the end of the latest downtrend.
With Bitcoin forming an inverse head & shoulder pattern with a target of $49,000 as alluded by market analyst Carl Martin, it remains to be seen whether this will signify a reversal pattern to the upside.
BTC also recently inched closer to the 200-day MA, and if it closes above this line, which shows the average closing price for the last 200 days or roughly 40 weeks of trading, then an uptrend is likely to be activated.
Image source: Shutterstock


 Bitcoin
  Ethereum
  Tether
  XRP
XRP  Solana
  USDC
USDC  Dogecoin
  TRON
TRON  Cardano
Be the first to comment