Published 2 hours ago
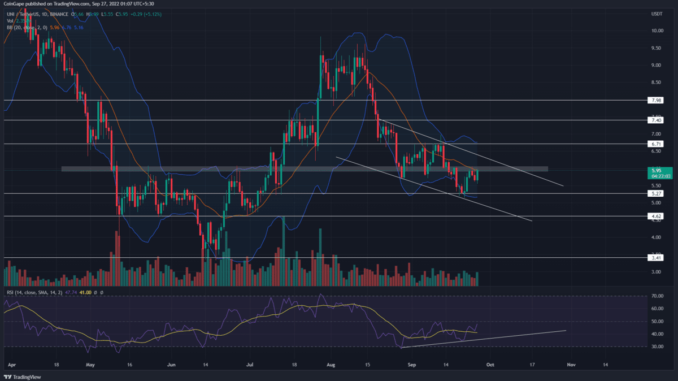
Under the influence of a falling channel pattern, the Uniswap token price showed a steady downfall in the past five weeks. However, the very nature of this pattern is to resume a strong bull rally once the price breaks the overhead trendline. Thus, interested buyers must wait for pattern breakout to get the right entry opportunity.
Key points Uniswap token price analysis:
The UNI price will continue its downward spiral until the falling channel pattern is intact
A bullish RSI divergence suggests the UNI prices may soon witness a significant recovery
The 24-hour trading volume in the Uniswap token is $120 Million, indicating a 88% gain.

The recent correction in the crypto market plunged the Uniswap token to local support of $5.27. The downfall has offset nearly 70% of gains obtained during the previous recovery rally. The coin price rebounded from the $5.27 support and initiated a minor pullback.
The price reversal soared the Uniswap token price by 14.3% and retested the $6 level as potential resistance. Last three days, the coin chart showed a higher price rejection candle at the $6 resistance, indicating the sellers are aggressively deafening this level.
Moreover, the daily time frame chart showed the formation of a falling parallel channel pattern. The resistance trendline of this pattern wavering at the $6 mark offers an additional hurdle against the bullish growth.
This confluence resistance could exert significant selling pressure on traders to revert the prices lower. As a result, the potential reversal will indicate the resumption of prevailing correction and tumble of the Uniswap token price by 10.84% to break the $5.27.
On a contrary note, the technical setup indicates the coin price should eventually breach the resistance trendline to trigger a new recovery rally.
Technical indicator
RSI indicator: the daily-RSI slope shows an evident bullish divergence concerning the last two lower lows in price action. This divergence indicates growth in bullish momentum and a better possibility for the bullish breakout from the channel pattern.
Bollinger band indicator: the coin price retest to the indicator’s midline will encourage downfall continuation.
Resistance levels- $6, $6.7
Support levels- $5.27 and $4.65
The presented content may include the personal opinion of the author and is subject to market condition. Do your market research before investing in cryptocurrencies. The author or the publication does not hold any responsibility for your personal financial loss.
Close Story


 Bitcoin
  Ethereum
  Tether
  XRP
XRP  Solana
  USDC
USDC  Dogecoin
  TRON
TRON  Cardano
Be the first to comment